Vim, LaTeX and High School
This September, after a summer full of programming, I was forced back into my junior year in high school. Back to writing English essays, lab reports, and projects. Luckily, sometime over the summer I discovered LaTeX. LaTeX has many advantages over a proprietary WYSIWYG word proccesor like Microsoft Word or Apple’s Pages. Its free, it’s portable, and it’s friendly with mathematical and scientific notation out of the box. However, It also has its share of disadvantages. One of these disadvantages is the steep learning curve. Unlike the WYSIWYG editors, it’s not straightforward to set up or use. This is why I am writing this blog post, to share my experiences and help bootstrap someone eager to get started with LaTeX.
The Setup
Installing and setting up LaTeX on your machine varies, depending on what operating system you are on. The LaTeX project website lists some good TeX distributions available for download. I own a MacBook running OS X, so I have downloaded and installed MacTeX. It is a big download (>1GB), but it is comprehensive, including everything you need to get started.
To build TeX files into PDFs, I have found Rubber to be the easiest and most comprehensive solution out there. It abstracts away all the tasks involved with building a TeX document, and works on both Linux and OS X without problem. It is available for download and install in many package managers, including Homebrew on OS X.
If you use Vim, I highly recommend the TeX-PDF plugin. As the name implies, the plugin’s sole purpose is to build TeX into finished PDFs, using whatever is available. It will use Rubber if it finds it on the system. The plugin is well suited for high school projects, because building to PDFs is probably the only thing you need to do. Using Vundle, installation is as simple as adding Bundle "TeX-PDF” to your .vimrc file.
Getting Started
There are many resources available to those starting out with LaTeX. I have chosen to learn as I go, and figure out how to do something when I need to do it. However, I have learned some tips and tricks that would be particulary useful for fellow high school students.
Science
In writing lab reports for science classes, I have found the packages mhchem and siunitx to be very useful. Both of these are included in the TeX Live and MacTeX distributions. The first package, mhchem, makes it very easy to write out chemical formulae. It is extremely comprehensive, and supports all the notation I have needed for AP Chemistry thus far. To write the formula for dichromate, it simplifies
1
3\,\mathrm{Cr}_2^{\strut}\mathrm{O}_7^{2-}`
into
1
\ce{3Cr2O7^2-}
to draw
\[\ce{3Cr2O7^2-}\]The other package, siunitx, allows you to typeset physical quantities with ease. For example, you can express the specific heat capacity of water with
1
\SI{4.18}{\joule\per\gram\per\celsius}
to draw
\[\SI{4.18}{\joule\per\gram\per\celsius}\]siunitx supports (almost) every SI unit under the sun.
English
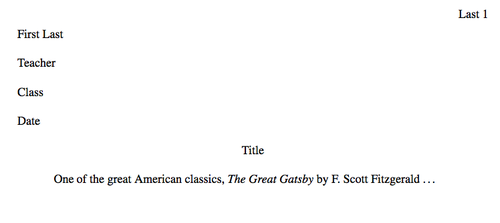
Writing English essays in LaTeX is very easy to do, thanks to the mla-paper package. It takes care of the MLA header in one line, which is very useful.
and the code:
1
2
3
4
5
6
7
8
9
10
11
12
13
14
\documentclass[12pt]{article}
\pagestyle{plain}

\usepackage{fullpage}
\usepackage{ifpdf}
\usepackage{mla}

\begin{document}
\begin{mla}{First}{Last}{Teacher}{Class}{Date}{Title}

One of the great American classics, \emph{The Great Gatsby} by F. Scott Fitzgerald \ldots

\end{mla}
\end{document}
Plotting
In all of my science classes, I have had to plot points on a graph, in one form or another. Yes, there is a package for that. Based on the graphics package pgf, pgfplots can be used to create high quality plots of all kinds. Here is a recent example of a project I did in AP Calculus, graphing a logistic function:
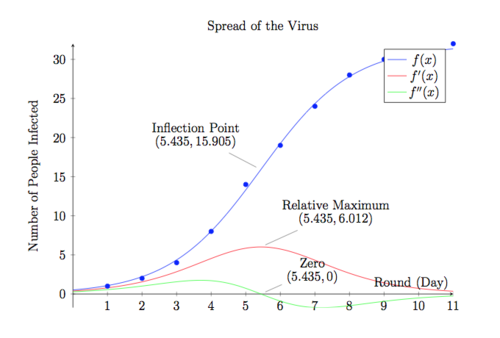
This example has four plots overlaid on top of one another. A scatter plot, the logistic regression, and its first and second derivatives. This example also includes labeled nodes, and a legend. pgfplots, like many of the other packages, is extremely comprehensive and extensible. Here is the code:
1
2
3
4
5
6
7
8
9
10
11
12
13
14
15
16
17
18
19
20
21
22
23
24
25
26
27
28
29
30
31
32
33
34
35
36
37
38
39
40
41
42
43
44
45
46
47
48
49
50
51
52
53
54
\documentclass[12pt]{article}
\pagestyle{plain}

\usepackage{pgfplots}

\begin{document}

\centering

\begin{tikzpicture}
\begin{axis}[
  height=10cm,
  width=\textwidth,
  axis y line=left,
  axis x line=middle,
  title=Spread of the Virus,
  xlabel=Round (Day),
  ylabel=Number of People Infected]

% Points
\addplot[only marks, forget plot, blue] table[x=Day,y=People]{
Day People
1   1
2   2
3   4
4   8
5   14
6   19
7   24
8   28
9   30
10  30
11  32
};

% Regression
\addplot[smooth,blue,mark=none, domain=0:11,samples=40]{ 31.808 / (1 + (60.9 * e^(-0.756 * x))) };
\addplot[smooth,red,mark=none, domain=0:11,samples=40]{ (1464.45 * e^(0.756 * x))/(60.9+e^(0.756 * x))^2 };
\addplot[smooth,green,mark=none, domain=0:11,samples=40]{ (e^(-0.756 * x) * (67424 * e^(1.512 * x) - 1107.13 * e^(2.268 * x)))/(60.9+e^(0.756 * x))^3 };

% Important points
\node[pin=135:{\shortstack{Inflection Point \\ $(5.435,15.905)$}}] at (axis cs:5.435,15.905) {};
\node[pin=45:{\shortstack{Relative Maximum \\ $(5.435,6.012)$}}] at (axis cs:5.435,6.012) {};
\node[pin=15:{\shortstack{Zero \\ $(5.435,0)$}}] at (axis cs:5.435, 0) {};

% Legend
\addlegendentry{ $f(x)$ }
\addlegendentry{ $f'(x)$ }
\addlegendentry{ $f''(x)$ }

\end{axis}
\end{tikzpicture}

\end{document}
Conclusion
Deciding to switch to using only LaTeX for my schoolwork this year was a fantastic decision. Although I had to learn as I went, often under time constraints, it has certainly paid off. I can now edit my schoolwork with Vim. Mathematical and scientific notation is easy to write, and not a hassle anymore. I don’t have to rely on a proprietary word processor. I plan on taking this skill with me when I eventually head off to college.
Discuss on Hacker News here.